


Over the past three years, Guemes Island Ferry ridership trends show a notable shift that aligns with the fare increases we’ve experienced. Looking at the data, total ridership has changed significantly. Ferry traffic has declined year-over-year.
This suggests that ticket price elasticity is at play: higher fares are discouraging people from using the ferry, leading to less farebox revenue. At the same time, residents and visitors traveling less even by walking, biking, or carpooling instead of paying higher rates.
The takeaway is that while the ferry is still serving a large number of people, the revenue mix and demand profiles are changing. If this trend continues, it could have implications for both operations and long-term funding, since ferry fares contribute significantly to overall operations and maintenance costs. This is an important signal that fare policy is influencing how people choose to use the ferry.

Here’s a comparison based on the ridership and fare policy. Keep in mind there was a Ferry Outage in 2023 and Fare increase in 2024 and again in 2025. There was elasticity if data presented in that way:
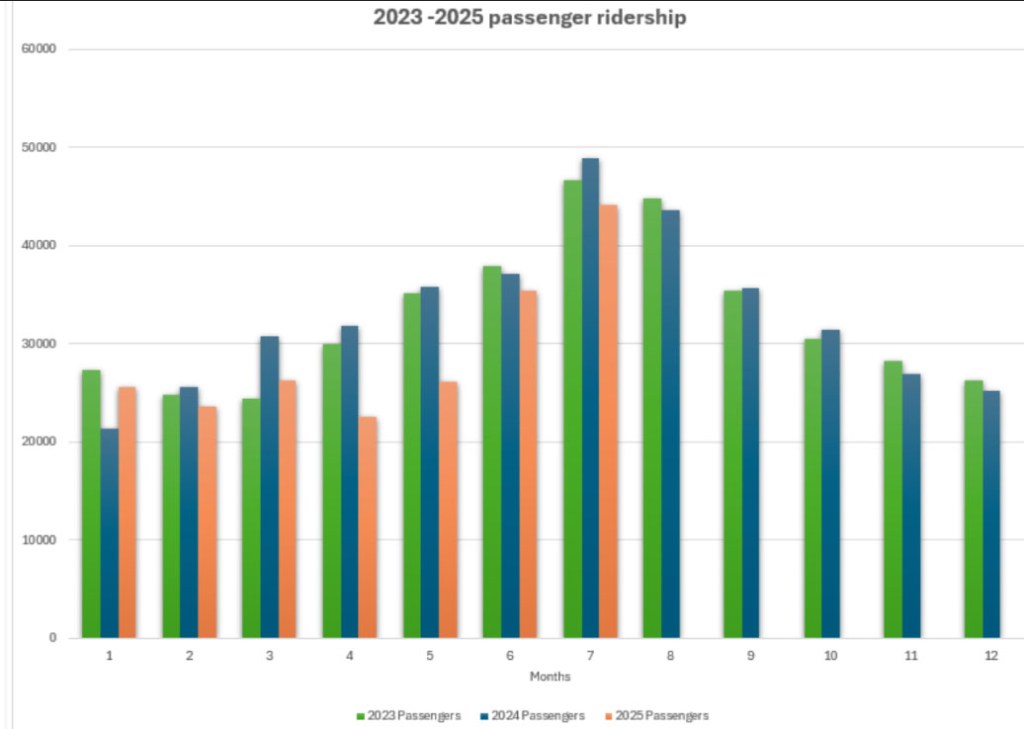
January & February 2023 vs. 2025 (-12%)
- Fare change: Increased ferry fares.
- Ridership impact: January vehicles dropped to 12,589 in 2025 from 15,746 in 2023, while passenger ridership dropped to 25,613 in 2025 from 27,373 in 2023.
- Interpretation: Vehicle and passenger elasticity in response to fare increases.
July 2023 vs. 2025 (-10%)
- Fare change: Continued fare increases in 2024 and 2025.
- Ridership impact: Vehicles 18,220 in 2025 vs. 20,204 in 2023; passengers 44,096 vs. 46,581 in 2023.
- Interpretation: ongoing price elasticity, due to fare increases and result in less revenue.
Key Patterns
- Vehicle ridership: Shows a clear downward shift in every operating month of 2025 versus 2023, a sign that demand is sensitive to price hikes.
- Passenger ridership: Down on average of 10% due to sensitivity to fare increases. Users even refrain from walking, biking, or carpooling.
Summary Table
| Month | Vehicles (2025) | Vehicles (2023) | Passengers (2025) | Passengers (2023) | Context |
|---|---|---|---|---|---|
| January | 12,589 | 15,746 | 25,613 | 27,373 | Fare increase |
| February | 13,029 | 13,666 | 23,663 | 24,793 | Fare increase |
| June | 16,836 | 19,001 | 35,332 | 37,932 | Fare increase |
| July | 18,220 | 20,204 | 44,096 | 46,581 | Fare increase |
This real-world data highlights how fare changes correlate with vehicle and passenger ridership declines in headcounts throughout 2025, except in the months when service was suspended.

One response to “Higher Fares Show Less Cars and Passengers”
[…] 15% for both passengers and vehicles, and will continue to decrease as rates continue to increase. Lower ridership = lower revenue. That is due to the increased fares this year. The proposal fails to acknowledge this, and instead […]
LikeLike